
Done!
Loading content...

Choose a method to get started. No matter what you pick, we'll respond promptly with the professional care you deserve.


Older infrastructure and density correlate with higher property crime rates than city averages.
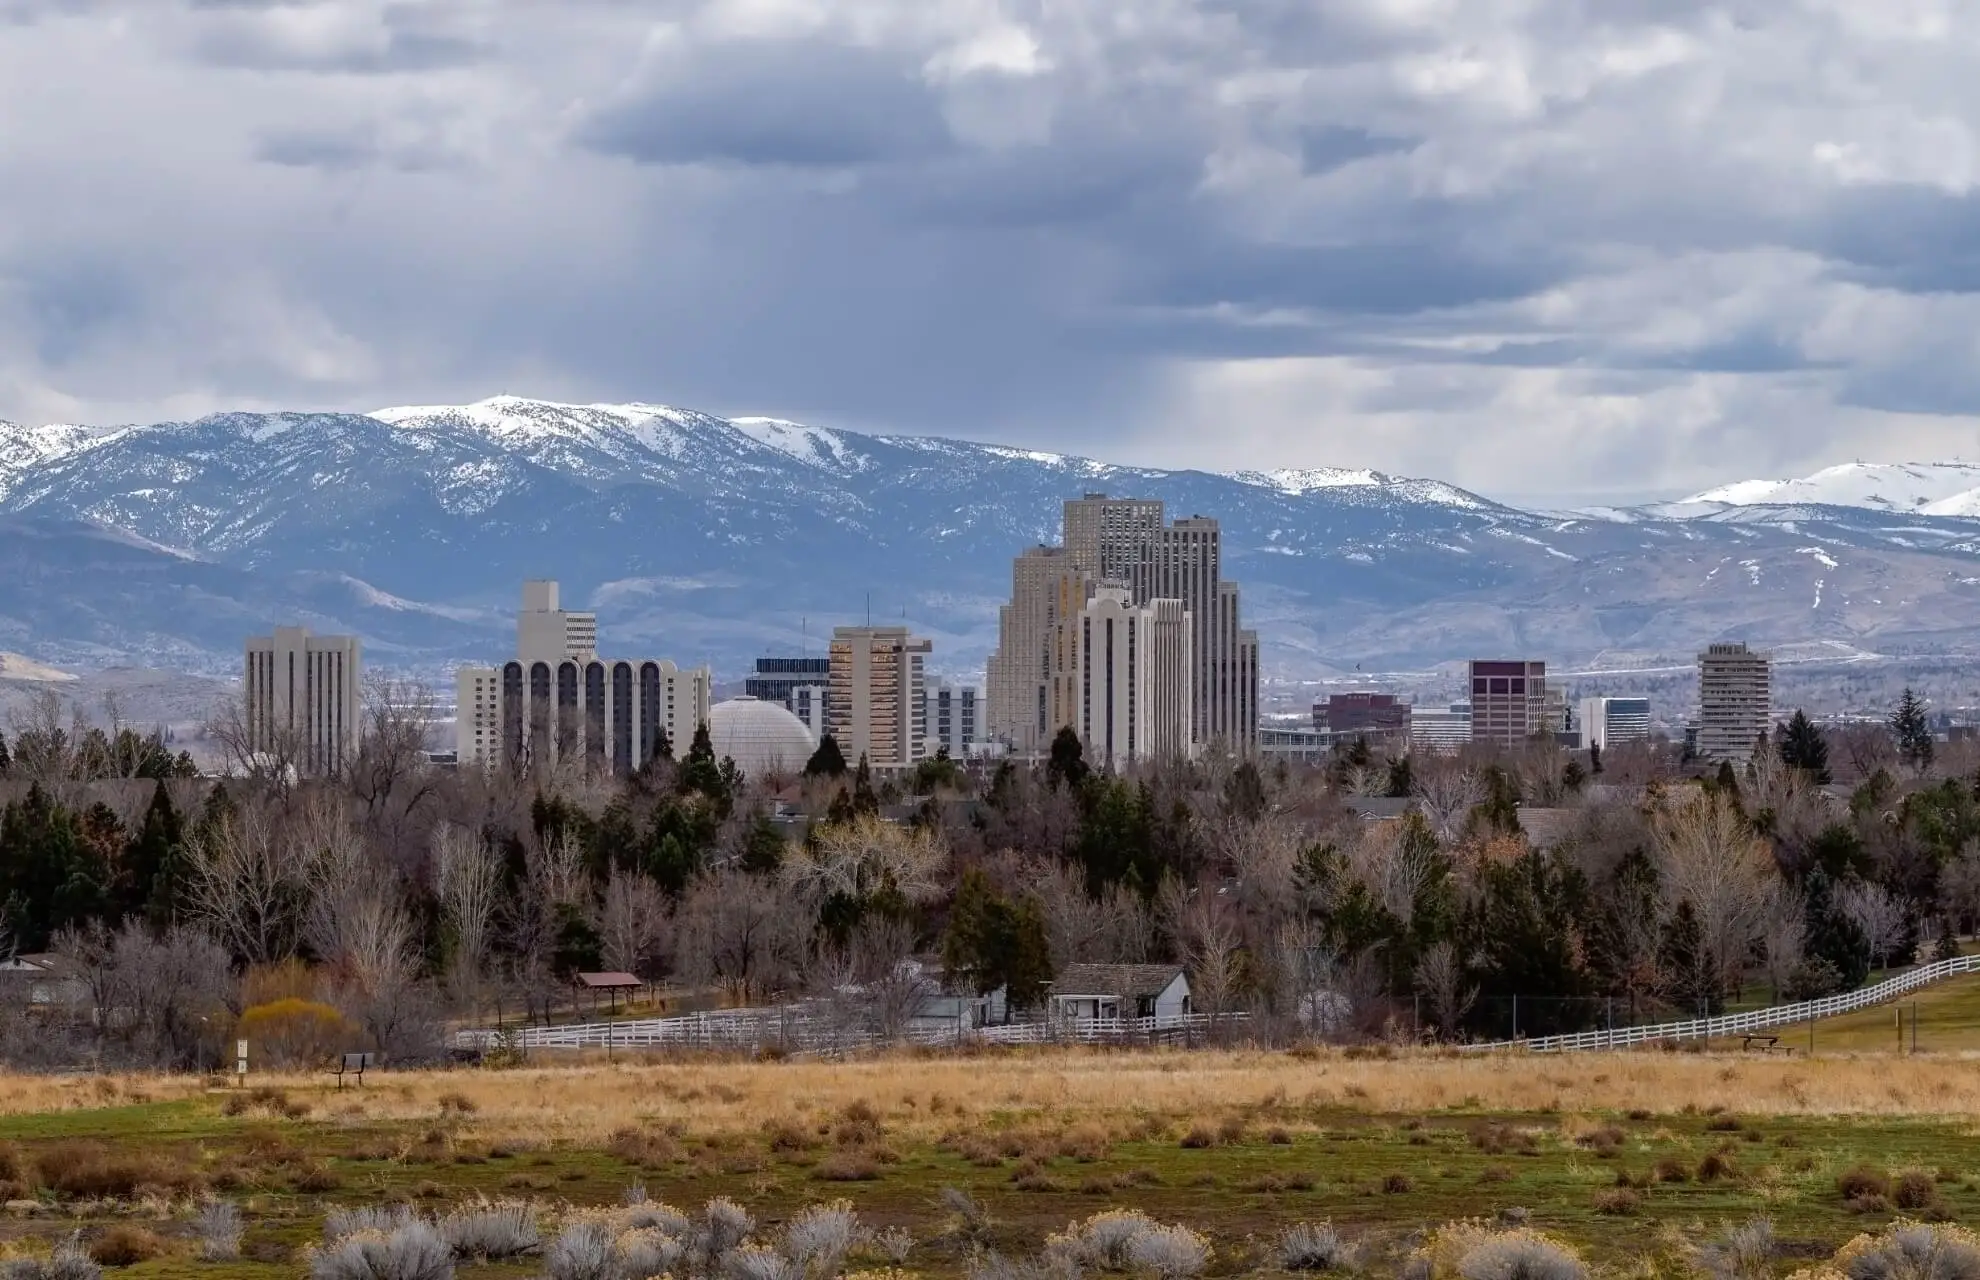
Encompassing the historic core between the Truckee River and Plumb Lane, this sector features dense mixed-use development, entertainment districts, and diverse residential neighborhoods with significant variations in property conditions and land use intensity¹.
Approximately 28,500 residents across 3.1 square miles, with median household income of $61,000 (11% below city median). Renter-occupied units dominate at 68%, concentrated in multi-family structures².
Notable mix includes pre-1940s bungalows (35%), mid-rise apartments (45%), and converted commercial lofts (20%). Lot coverage averages 85% in core blocks, limiting defensible space³.
Entertainment districts (Midtown, Riverwalk) generate 48% of reported assaults and 62% of vehicle break-ins between 10PM-4AM, with incident density 3.1x higher than residential-only blocks⁴.
Residential burglary rates peak in alley-accessed properties lacking rear lighting (27% higher than street-front units). Package theft reports increased 22% YoY in multi-unit buildings without secured mailrooms⁵.
Sidewalk coverage exceeds 90%, but 32% of residential streets have lighting deficiencies per city audits. Narrow alleys behind historic properties create visibility obstructions⁶.
Aging underground infrastructure contributes to 40% more water/sewer line failures than city average. Above-ground transformers in older districts increase outage risks during wind events⁷.
Hospitality sector employs 38% of local residents, creating non-traditional work schedules. Downtown offices generate 12,000+ daily commuters, straining parking infrastructure⁸.
Short-term rental concentration reaches 15% in Midtown, correlating with 31% higher noise complaints and 19% more unauthorized parking incidents in residential blocks⁹.
Wingfield Park and Riverwalk attract 1.2 million annual visitors, creating pedestrian congestion points with limited surveillance coverage during off-peak hours¹⁰.
43% of multi-family structures built pre-1980 lack modern access control systems, and 67% have unmonitored rear entrances per fire code inspections¹¹.


.svg)


.svg)

.svg)
.svg)
.svg)

.svg)
.svg)


