
Done!
Loading content...

Choose a method to get started. No matter what you pick, we'll respond promptly with the professional care you deserve.

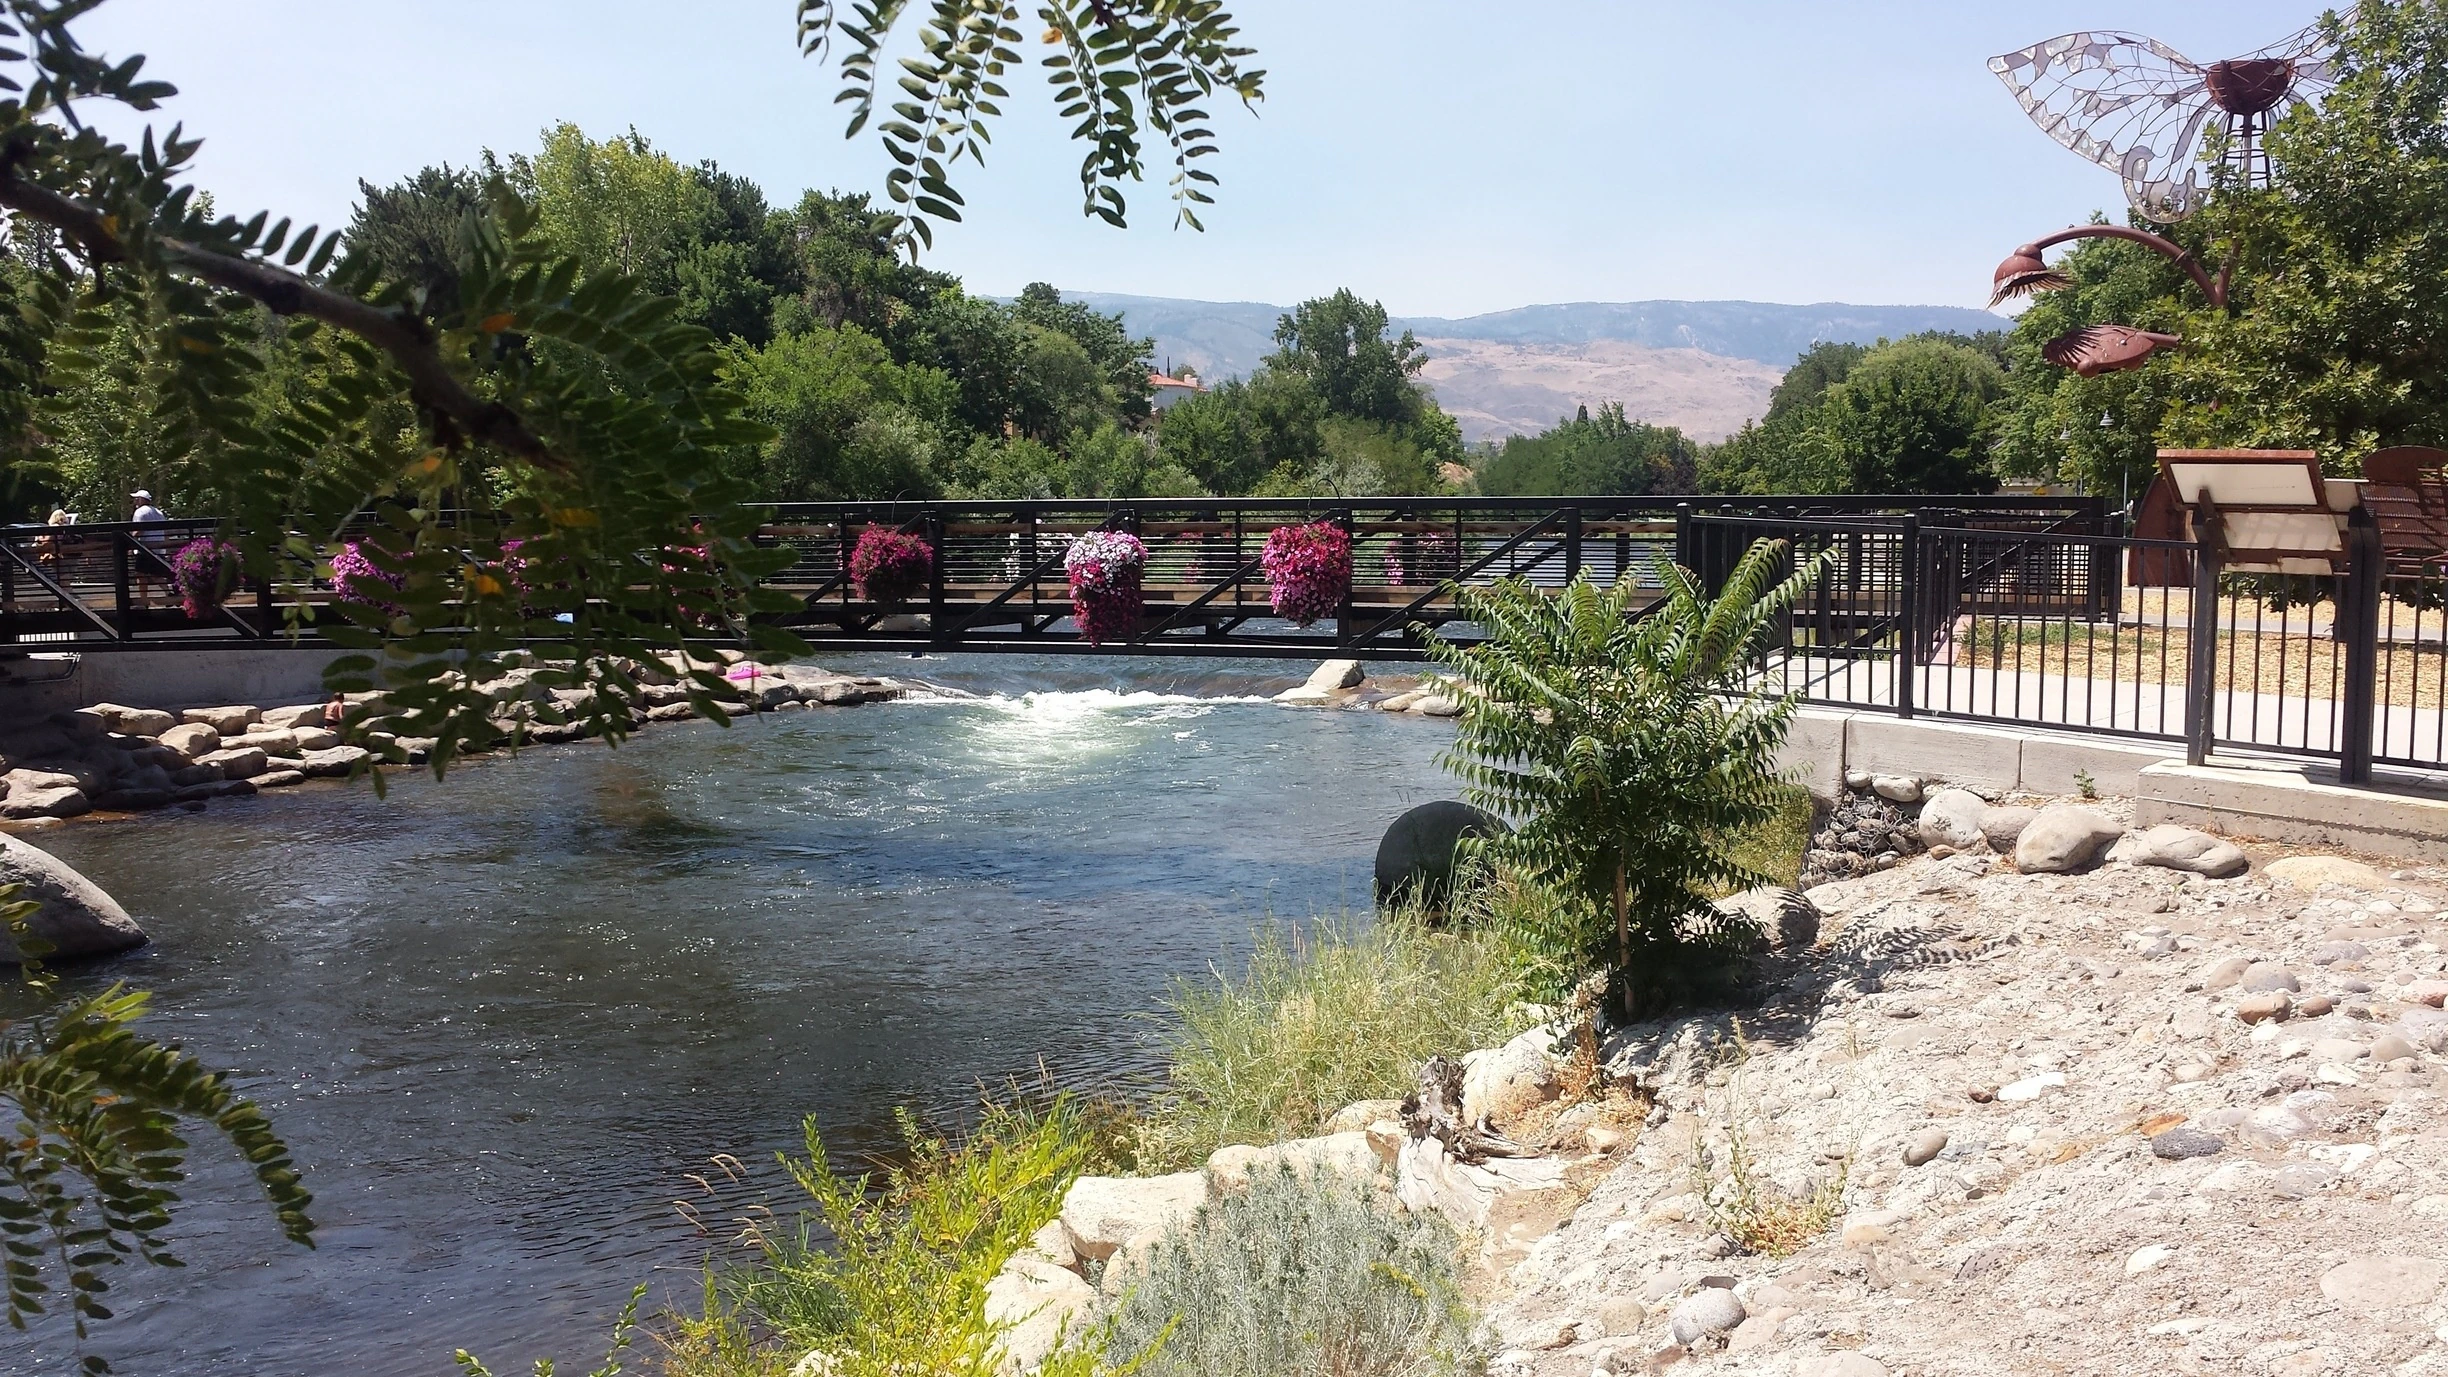

Riverfront dining draws higher property crime and transient activity than adjacent neighborhoods.
The Riverwalk District, located in the heart of downtown Reno, is a vibrant urban area known for its scenic river views, cultural events, and mix of residential and commercial spaces. As a hub of activity, the district presents unique security considerations related to its dense population, infrastructure, and public amenities. The following sections provide a detailed, data-driven overview of the district's demographics, crime environment, infrastructure challenges, employment and lifestyle factors, and community amenities and vulnerabilities.
The Riverwalk District supports a population of approximately 5,000 residents, characterized by a diverse array of housing options such as apartments, condominiums, and single-family homes. Over the past decade, the district has sustained a consistent population growth rate of 2% annually, attributed to its central location and appeal to diverse demographic groups including young professionals and retirees.¹ The housing market reflects this demand, with median home prices increasing by 8% from 2023 to 2024, reaching $450,000 for single-family homes and $325,000 for condominiums.² Rental units dominate the housing stock at 60%, with vacancy rates declining to 3.5% in 2024, signaling high demand and constrained supply.³
Housing affordability poses a significant challenge within the district. With a median household income of $65,000, the average rent for a one-bedroom apartment stands at $1,800 per month, accounting for over 30% of median income.⁴ This affordability gap has driven increased housing density, with multi-unit developments comprising 75% of new construction permits issued in 2024.⁵
The Riverwalk District maintains a relatively low overall crime rate compared to other urban sectors of Reno, yet specific crime trends warrant attention. Data from the Reno Police Department indicates that violent crime rates are 15% below the city average, recorded at 2.5 incidents per 1,000 residents in 2024.⁶ Conversely, property crimes, encompassing theft and vandalism, have surged by 12% over the past two years, particularly in high-traffic zones such as the riverwalk pathways and commercial areas.⁷
Notable crime hotspots include the riverwalk corridor, where petty theft and vandalism predominate, especially during evening hours. In 2024, 45% of reported property crimes occurred within 500 feet of the riverwalk, underscoring the need for targeted security enhancements in these public spaces.⁸ Parking facilities have also experienced a 20% uptick in vehicle break-ins, correlating with increased tourism and event-related activity.⁹
The Riverwalk District contends with multiple infrastructure challenges that influence security and public safety. Aging water and sewer systems, with some components dating to the early 20th century, require substantial upgrades.
In 2023, the City of Reno classified 25% of the district's underground utilities as "high-risk" for failure, posing potential service disruptions and safety hazards.¹⁰ Traffic congestion, exacerbated during peak hours and event days, increases by up to 40%, potentially impeding emergency response times and heightening crowd-related risks.¹¹
Transportation infrastructure reveals additional vulnerabilities. The Arlington Avenue bridge, a critical access point, is under renovation until 2026, causing detours and elevated traffic on surrounding streets.¹² Public transit, including bus routes and bike lanes, reports safety concerns, with 15% of surveyed residents noting insufficient lighting and security at transit stops.¹³
The Riverwalk District serves as an economic nucleus, hosting over 200 businesses ranging from startups to established corporations. The unemployment rate stands at 3.2%, below the national average of 4.0%, indicative of a robust local economy.¹⁴ Median household income is $65,000, with 40% of residents employed in professional services, technology, and hospitality sectors.¹⁵
The district's lifestyle, defined by walkability, cultural events, and recreational access, attracts both residents and visitors.
Economic disparities persist, with 15% of households earning below $30,000 annually compared to 25% exceeding $100,000.¹⁶ These disparities may influence access to private security services and community resources, potentially creating localized vulnerabilities in lower-income segments.
The Riverwalk District features extensive public amenities, including parks, recreational spaces, and cultural venues, which enhance its appeal but introduce security challenges. The riverwalk, a focal point for activity, suffers from limited surveillance and lighting in certain areas, contributing to elevated crime rates.¹⁷ Public events such as monthly Wine Walks and seasonal festivals attract significant crowds, elevating risks of theft, assault, and public intoxication.¹⁸
The City of Reno has responded with measures such as increased police patrols and the deployment of 50 new surveillance cameras in 2024.¹⁹ Despite these efforts, 30% of residents report feeling unsafe walking alone at night, particularly near the riverwalk and in less-trafficked zones, per community surveys.²⁰


.svg)


.svg)

.svg)
.svg)
.svg)

.svg)
.svg)


