
Done!
Loading content...

Choose a method to get started. No matter what you pick, we'll respond promptly with the professional care you deserve.


Urban amenities coexist with prevalent property crime and problematic less-trafficked areas, especially after dark.
The downtown core presents a complex demographic and economic landscape with notable vulnerabilities in both population characteristics and housing infrastructure.
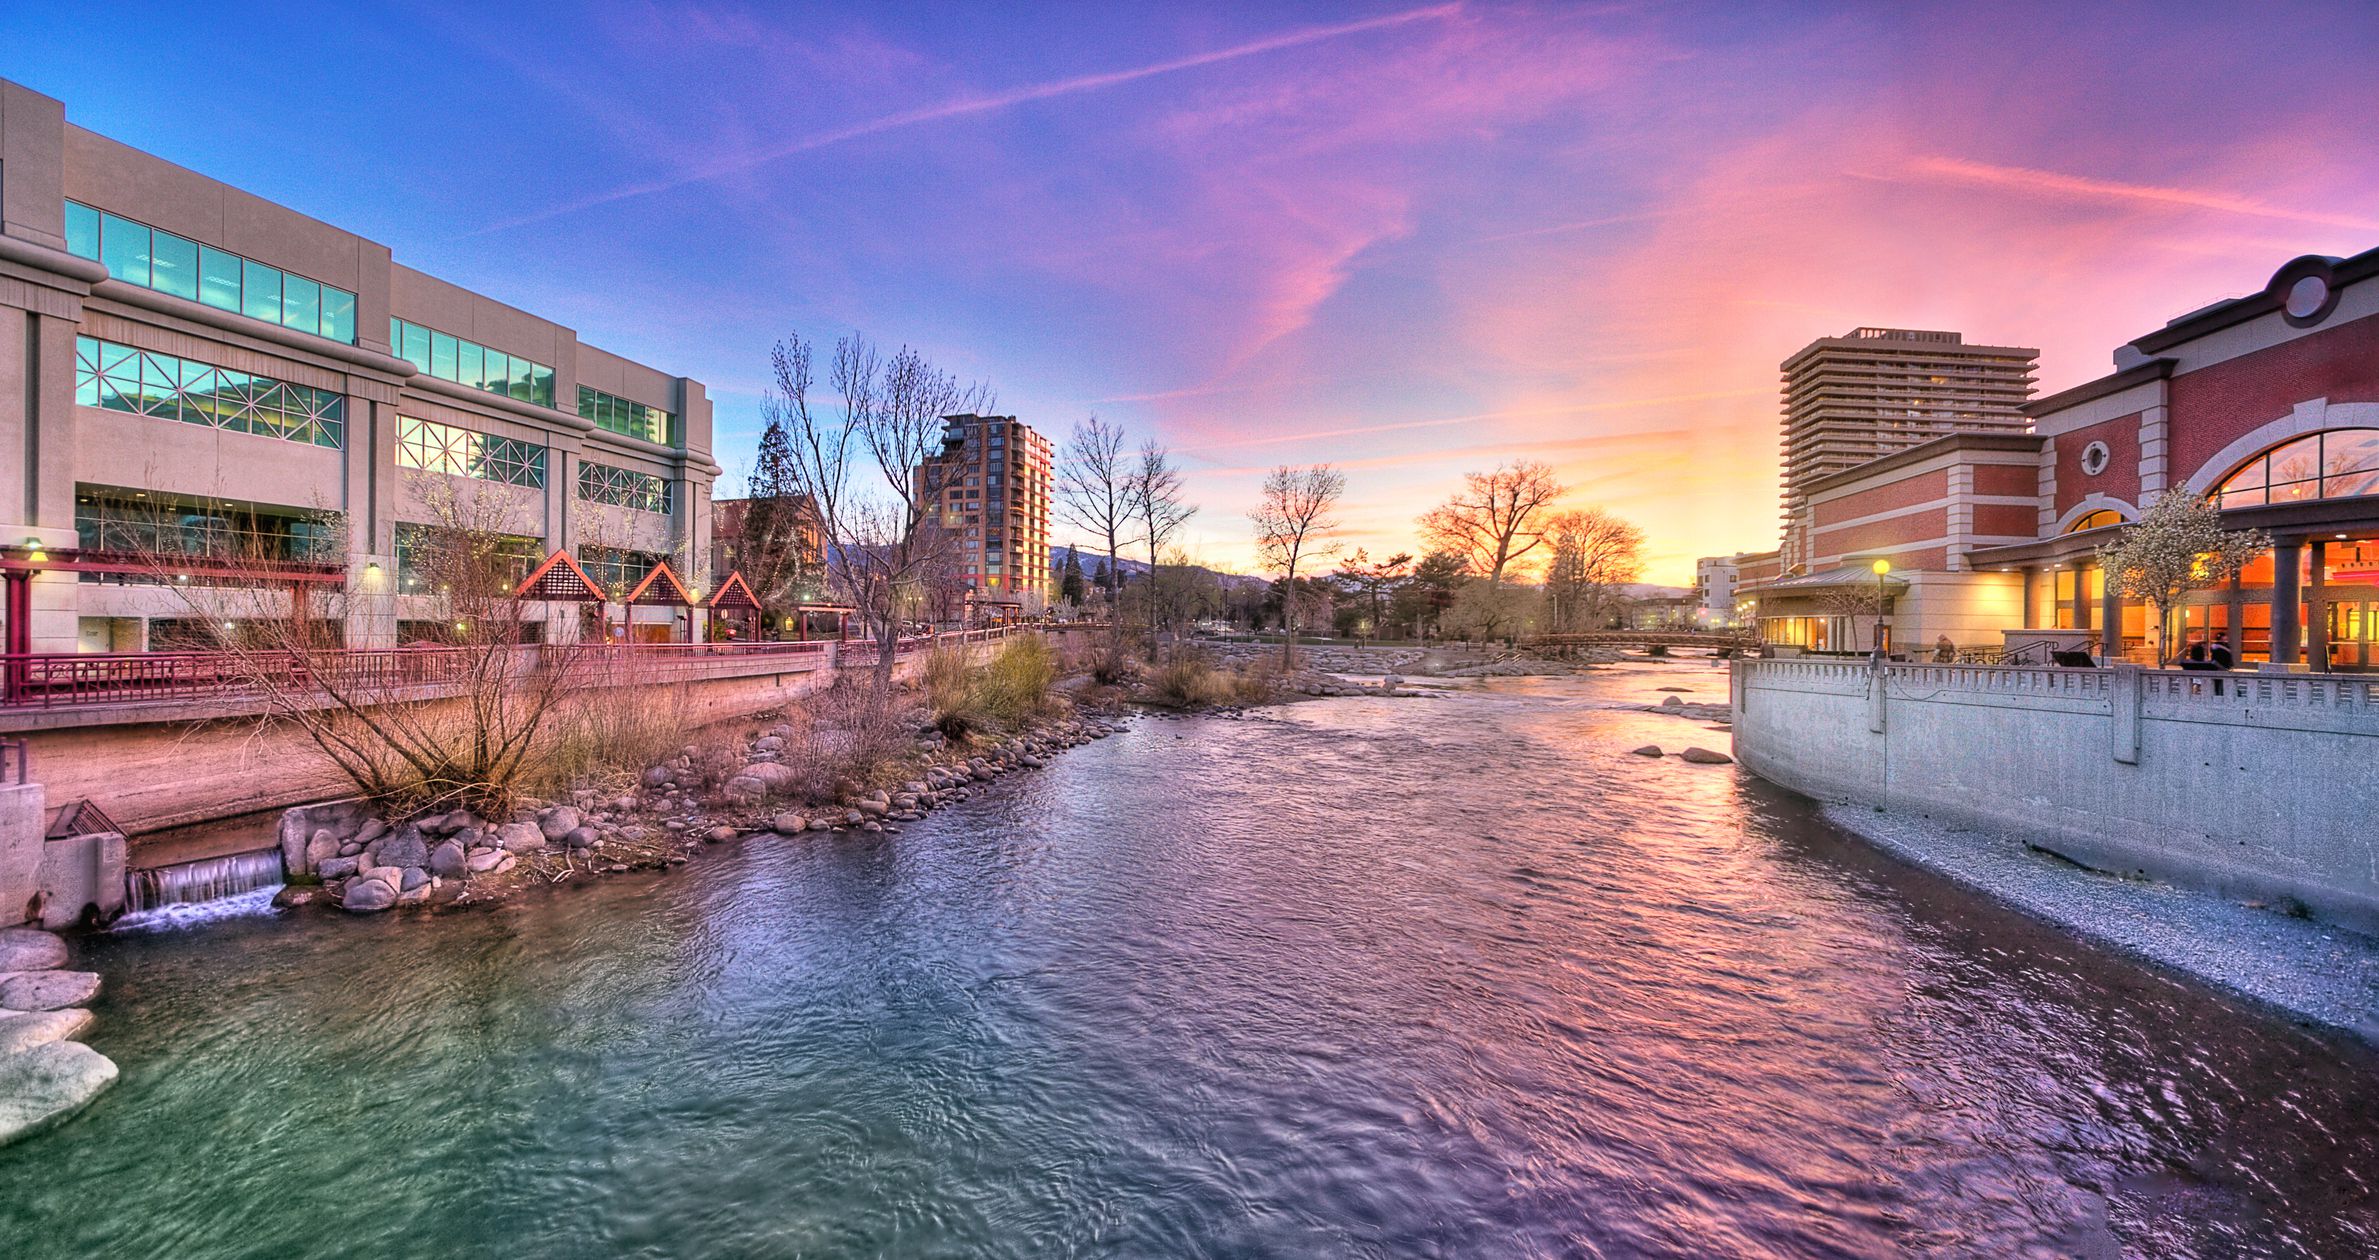
Downtown Reno encompasses approximately 110 blocks within a one-mile radius of the Reno Arch, serving as the city's central business and entertainment district.⁷ The area houses 8,186 residents with a median age of 41, where 61.51% of the 4,417 occupied housing units are rental properties.⁷
The median household income in downtown sits at $66,956, notably lower than the broader Washoe County median of $85,600.⁷ Demographic analysis reveals that almost 40% of downtown's population is aged 50 and above.²
The area experiences a significant housing development lag, with less than 10% of total housing units built within the last twenty years.⁶
Downtown Reno operates within a broader regional crime environment that significantly exceeds national averages across multiple categories.
According to FBI Uniform Crime Report data for 2023, Washoe County reported violent crime rates of 572 per 100,000 residents (54.6% above national average) and property crime rates of 2,556 per 100,000 residents (30.8% above national average).³
Reno's 2023 crime index of 338 was 1.4 times higher than the U.S. average, with the city ranking higher in crime than 92.5% of U.S. cities.⁴
The city reported 19 homicides in 2023, representing an increase from the previous year.⁴
Public safety resources in the downtown area face significant capacity constraints that impact response capabilities and patrol coverage.
The Reno Police Department operates with 358 officers (as of 2023), resulting in 1.5 officers per 1,000 residents—42.1% below Nevada's average and 52.6% below the national average.⁴
City officials note ongoing security challenges, particularly with nighttime enforcement, as expressed in city council meetings where members requested additional resources for late-night business district patrols.⁵


.svg)


.svg)

.svg)
.svg)
.svg)

.svg)
.svg)


