
Done!
Loading content...

Choose a method to get started. No matter what you pick, we'll respond promptly with the professional care you deserve.


Vibrant nightlife and commerce attract higher property crime, requiring vigilance against vehicle break-ins.
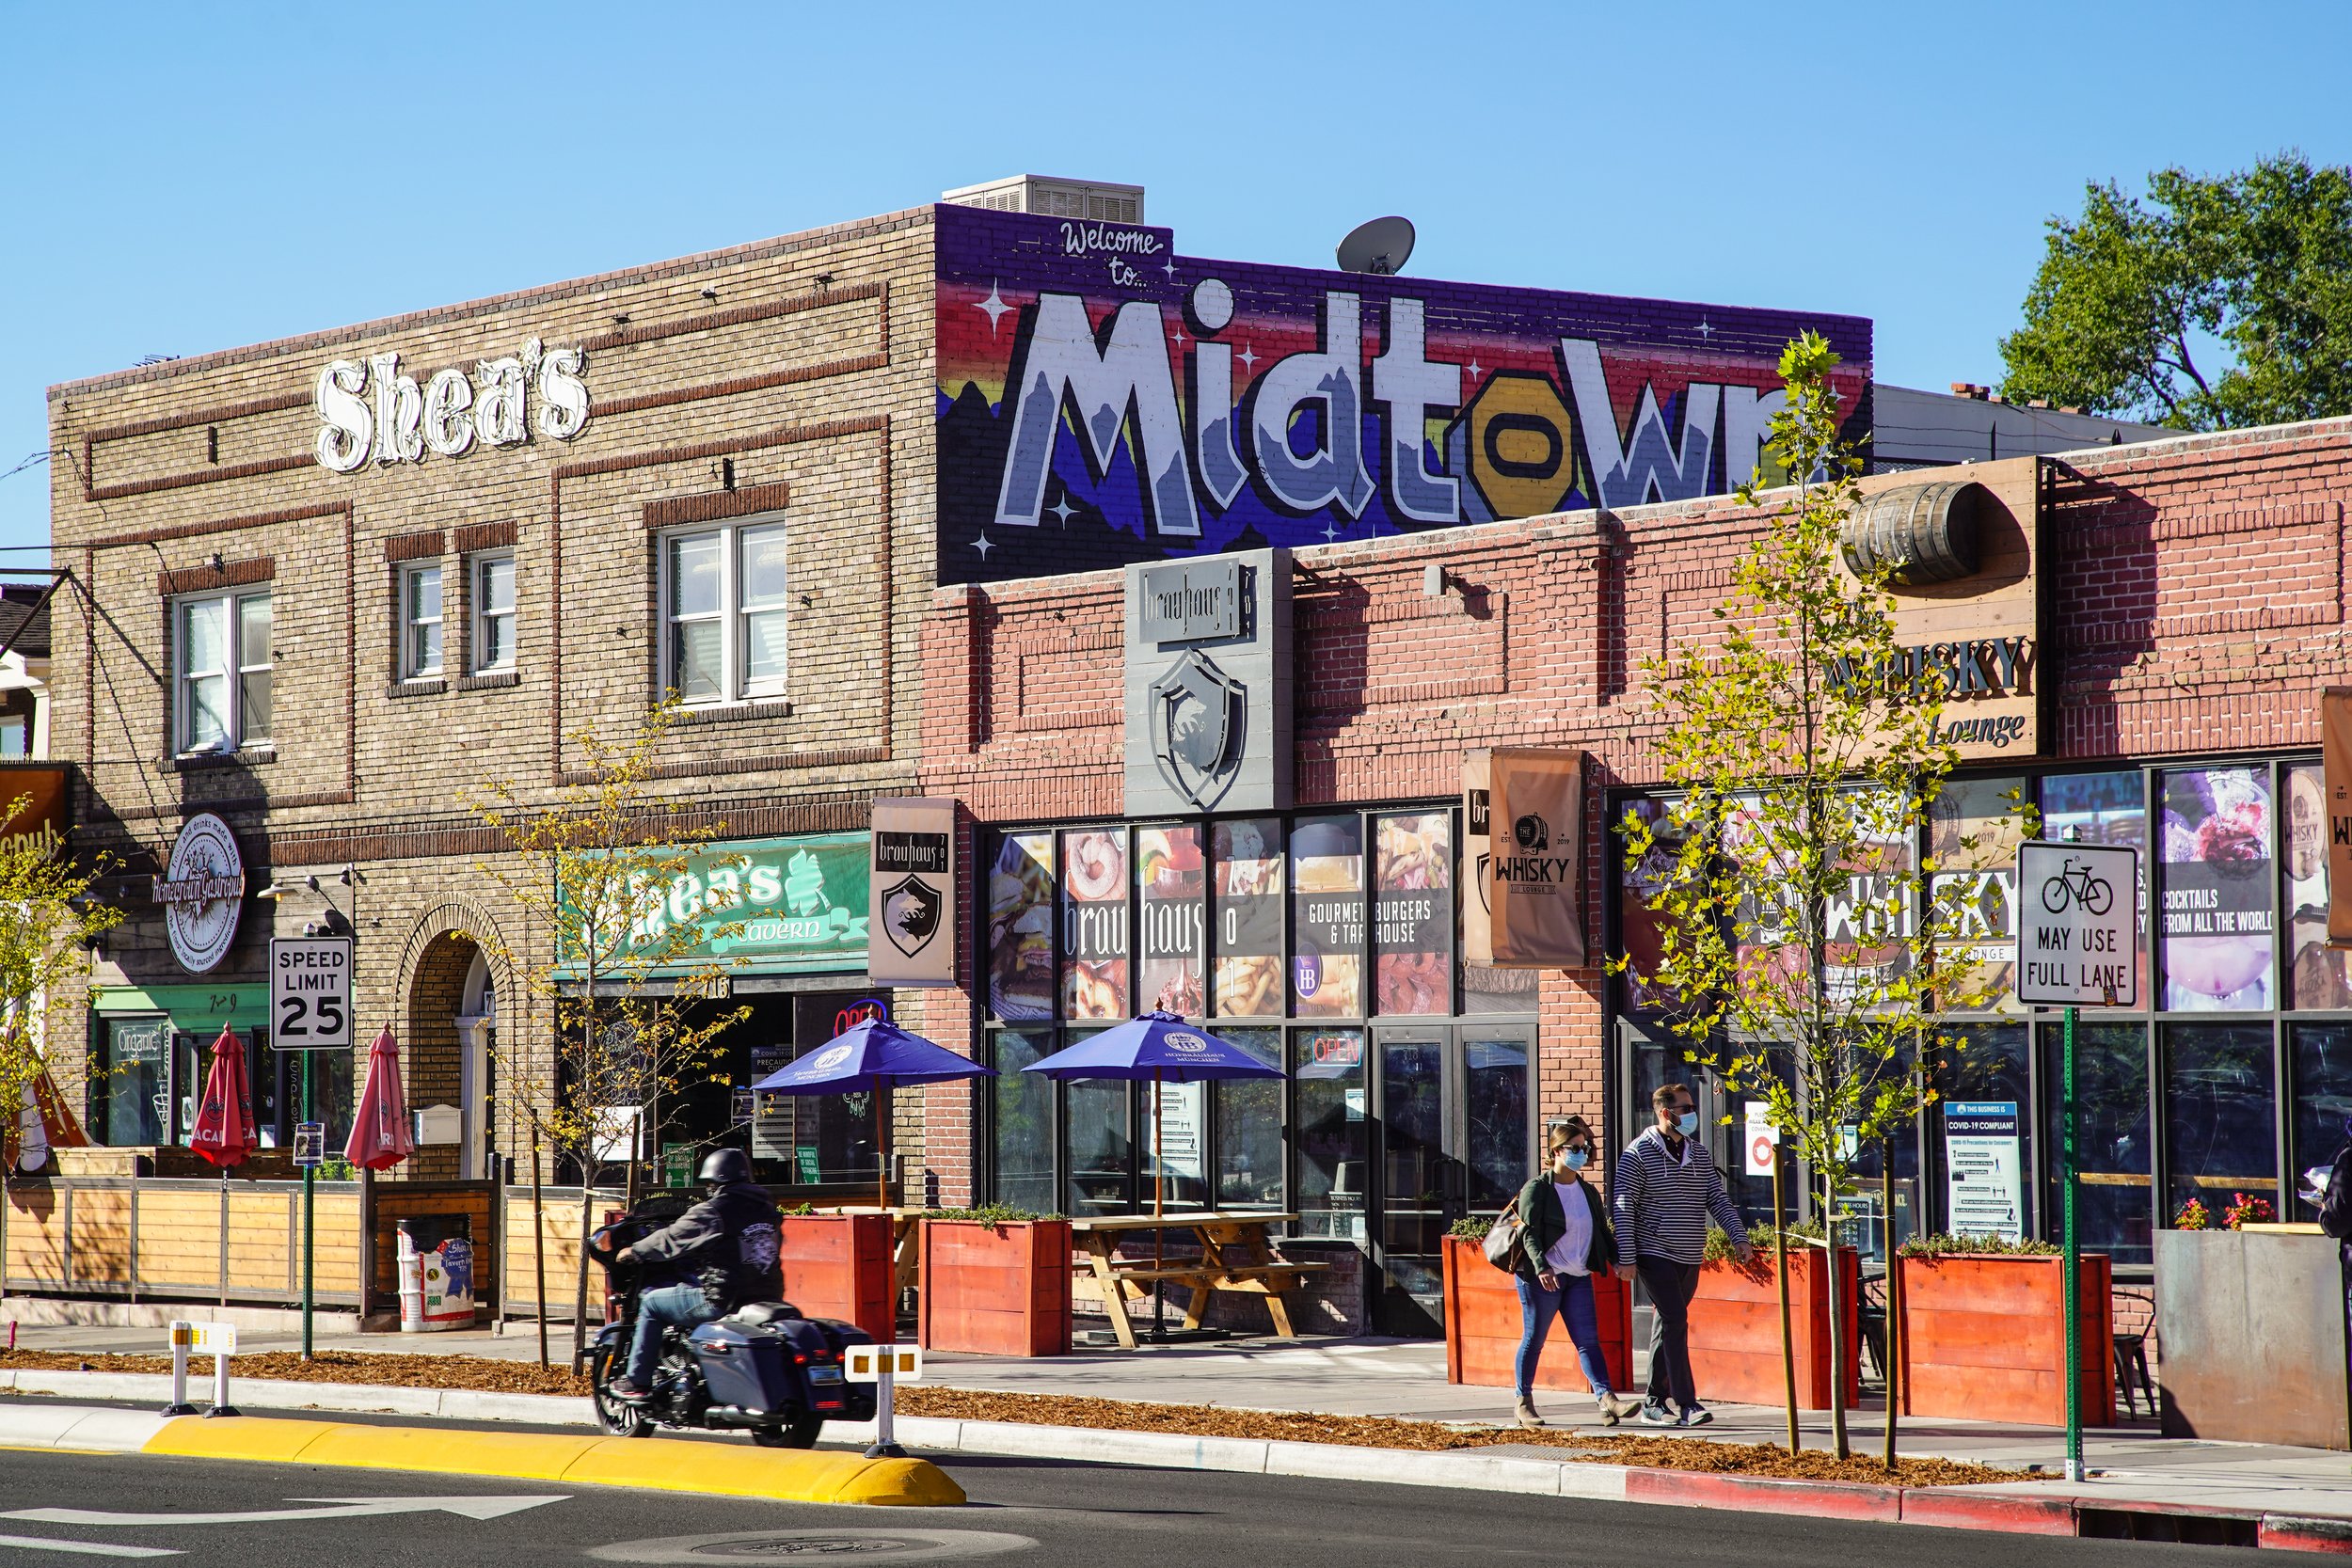
The Midtown corridor presents significant socioeconomic challenges within a densely populated urban environment that experiences higher crime rates than most comparable neighborhoods.
Midtown Reno houses 1,641 residents with a median age of 48 years in a concentrated commercial-residential corridor that runs parallel to Virginia and Center Streets.² The area encompasses approximately 1,006 housing units with 59.39% occupied by renters.²
The neighborhood represents a lower-middle income area with a median household income of $57,370, substantially below both the citywide median of $73,073 and the broader Washoe County median of $85,600.²¹ Income levels rank lower than 85.0% of U.S. neighborhoods.¹
Most residential properties were constructed between 1970 and 1999, with a median home value of $534,450.² The area maintains a 6.0% vacancy rate, positioned near the national middle range.¹
Midtown faces significantly elevated public safety challenges that exceed both city and national averages across multiple crime categories.
The neighborhood reports a crime rate of 107.4 per 1,000 residents during a standard year, substantially higher than surrounding areas.³ This places Midtown in the 18th percentile for safety, meaning 82% of neighborhoods are safer.³
Assault rates in Midtown receive an F grade, placing the area in the 4th percentile for safety, with 96% of neighborhoods experiencing lower assault rates.⁴ Residents face assault victimization odds as high as 1 in 64 in northwest sections of the neighborhood.⁴
By crime count, approximately 75 incidents occur annually in northern parts of Midtown, while southwestern areas experience around 15 incidents per year.³
The neighborhood experiences notable economic stress indicators that correlate with increased security risks.
Child poverty affects 18.7% of minors in the area, exceeding rates found in 66.7% of U.S. neighborhoods.¹ This represents a higher concentration of economic distress than most comparable areas.
Manufacturing and laborer occupations comprise 30.5% of the working population, while 27.6% work in executive, management, and professional roles.¹


.svg)


.svg)

.svg)
.svg)
.svg)

.svg)
.svg)


